
Two interactive front-ends exist, covering the same fields and the same underlying model: GUI/MIDAS.m, a MATLAB App Designer app, and octave/MIDAS_GUI.m, a plain-uicontrol GNU Octave rebuild (Octave cannot open .mlapp/App Designer files at all, so it isn’t a port of the same file - see Octave GUI below for what differs).
MATLAB GUI
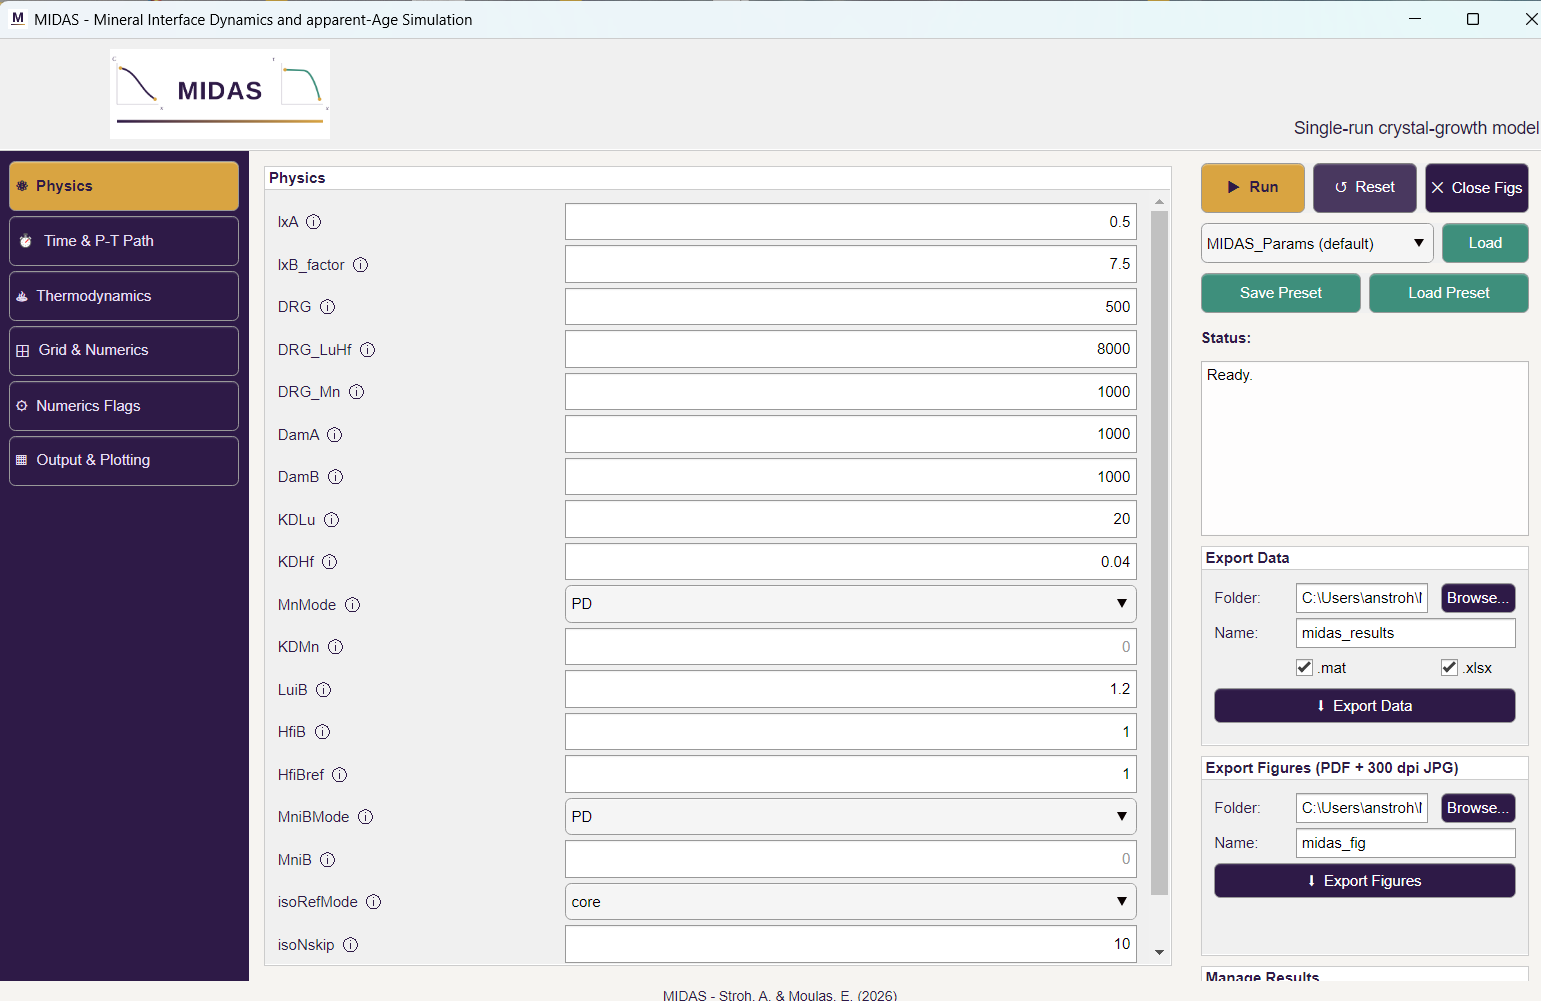
Launching it
cd GUI
MIDAS
Layout
- Left sidebar: tabs matching
MIDAS_Params.m’s own sections, science inputs first and bookkeeping last (Physics, Time & P-T, Thermodynamics, Numerics, Numerics Flags, Output & Plotting) - every field is exposed as its own control (numeric box, dropdown, checkbox, or a small vector of boxes), with the same explanatory text as the source file’s inline comments available as a hover tooltip. - Run / Reset / Close Figs: Run executes
MIDAS_Mainwith whatever’s currently in the form and shows every post-run figure (progress bar tracks each one). Reset restores every field toMIDAS_Params()’s defaults. Close Figs closes every open figure window from any past run (not just the latest one) without closing the app itself. - Load Example: pick any of the six example configurations (or plain
MIDAS_Params) from the dropdown and click Load to populate every field from it - a starting point, not a locked-in choice, since every field stays freely editable afterwards, so you can dial in your own configuration without typing all ~60 values by hand. - Save/Load Preset: save the current form to a
.matfile, or load a previously saved one back in. - Export Data / Export Figures panels: after a run, export
R’s scalar/summary data to Excel, or export any of the figures from that run as a vector PDF + 300 dpi PNG (both with and without their title). - Results list: browse, refresh, or delete previous runs’ output folders (each run gets its own timestamped folder under
results/).
Closing it
Just close the window (or close all at the MATLAB command line) - nothing is written to disk on exit beyond what Run/Export already saved, so there’s no save-before-quit step.
Notes
- The GUI dynamically reads its default values from
MIDAS_Params()at startup - editing that file changes what the GUI shows next time it launches, no GUI code changes needed. - Every field’s tooltip is generated from the same metadata table the GUI uses to build its own controls, so it can’t drift out of sync with what the field actually does.
- The Load Example dropdown reads the six
examples/ExampleN.mfiles directly - it needs them (andMIDAS_Params.m) to be on the MATLAB path, which the app adds itself at startup.
Octave GUI
octave/MIDAS_GUI.m covers the same ~60 fields, six examples, Run/Reset,
Save/Load Preset, Export Data/Figures, and Manage Results as the MATLAB
GUI above - built from scratch with Octave’s plain figure/uicontrol
(Octave has no App Designer, uigridlayout, or uitabgroup to port
against), so the look is plainer but the functionality is the same.
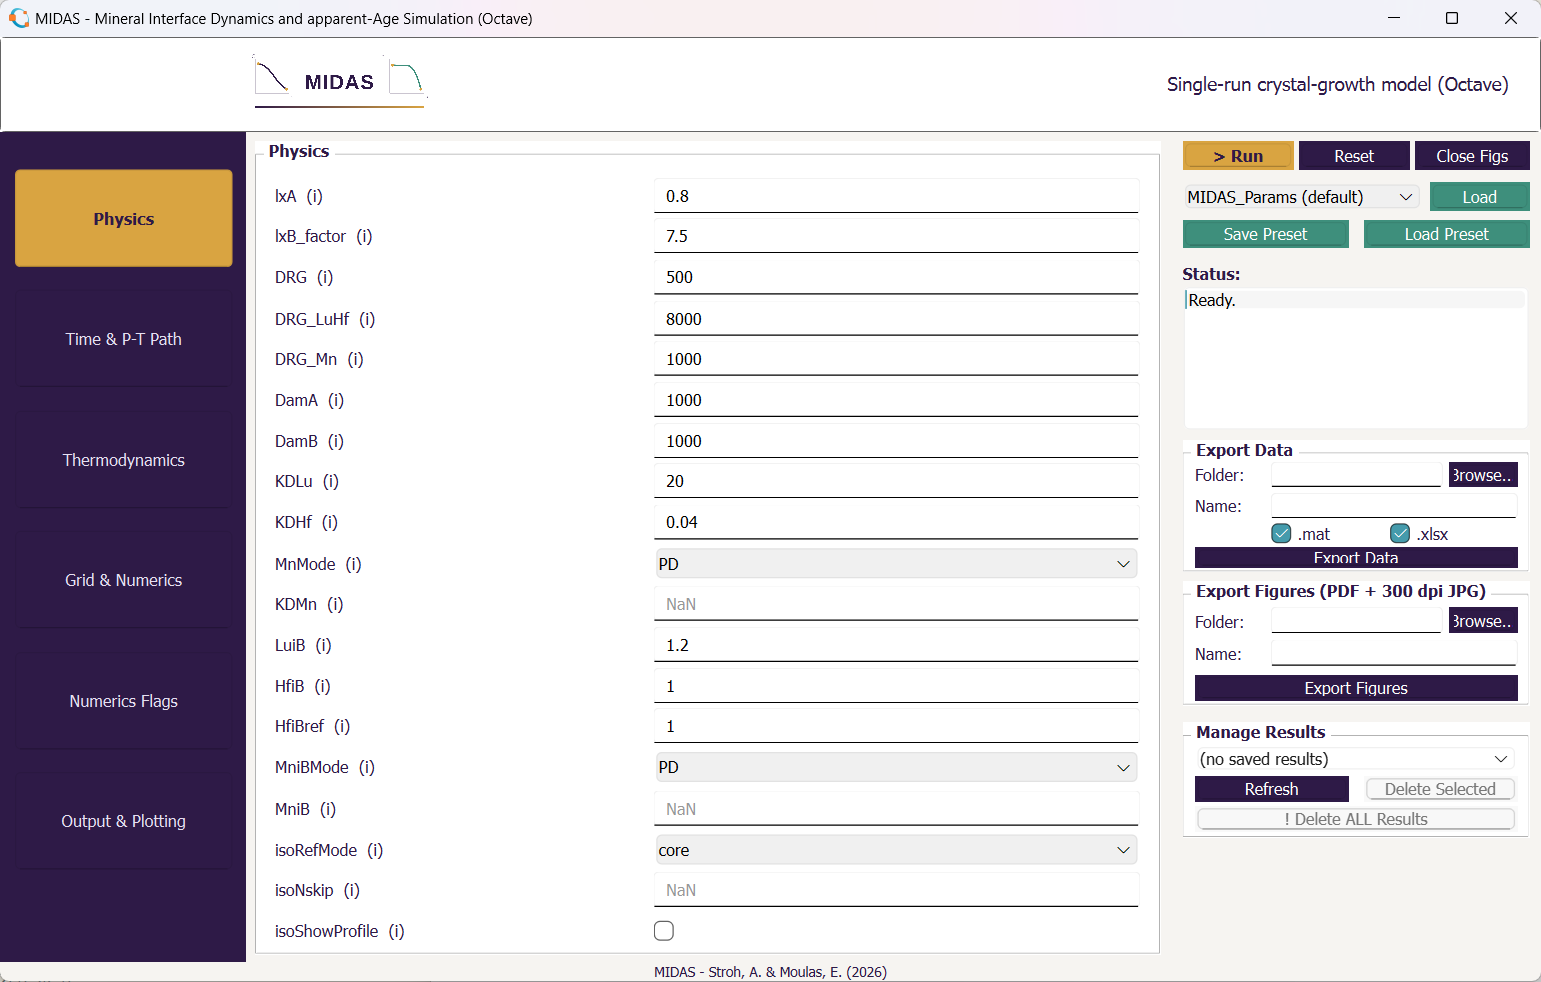
Launching it
cd octave
octave
>> MIDAS_GUI
Layout
- Sidebar tabs: the same six sections as the MATLAB GUI (Physics, Time & P-T Path, Thermodynamics, Grid & Numerics, Numerics Flags, Output & Plotting), switched via the sidebar buttons - hover any field’s label for its tooltip (same wording as
MIDAS_Params.m’s inline comments). - Run / Reset: same behavior as the MATLAB GUI - Run validates the form, executes
MIDAS_Main, and opens the same set of post-run figures; Reset restoresMIDAS_Params()’s defaults. - Load Example: pick one of the six examples from the dropdown, click Load.
- Save/Load Preset: same
.mat-file round trip as the MATLAB GUI. - Export Data / Export Figures: same as the MATLAB GUI - Excel/
.matfor data, vector PDF + 300 dpi JPG for figures. - Manage Results: browse/refresh/delete previous runs under
results/.
Closing it
Close the window normally. One caveat worth knowing about first: on this
Octave install (fltk graphics toolkit - see
octave/README.md
for why qt isn’t available here), closing a window with this many nested
panels/controls has been observed to crash the Octave process during
cleanup in a non-interactive batch test. Whether this also happens when
closing the window yourself in a normal interactive session hasn’t been
confirmed yet - if it does, no work is lost (nothing is written to disk on
close beyond what Run/Export already saved), but please report it either
way so this note can be corrected.
Performance
If you have a MATLAB license, prefer the MATLAB GUI for long or interactive runs - the Octave GUI’s live-updating plot is noticeably slower, for two compounding reasons:
- Octave has no native
tiledlayout/nexttile; the shim this repo uses instead (tiledlayout.m) deletes and rebuilds all 8 panel axes from scratch on every redraw, rather than updating the existing tiles in place the way MATLAB’s native version does. Two of those panels also rebuild acontourfphase-diagram plot and a colorbar every time, on top of that. - This install’s only available graphics toolkits are
fltk/gnuplot(see Graphics toolkit), notqt- less hardware-accelerated and generally slower to render.
Together, every recorded timestep of a run redraws the whole 8-panel figure from nothing, which adds up over a run with many recorded steps. Until the shim is optimized to reuse axes instead of rebuilding them, raising recordDT (fewer redraws over the same run) is the cheapest workaround available without code changes.
Differences from the MATLAB GUI
- Dropdowns are Octave’s native popup-menu style rather than a flat combo box - functionally identical.
- The “Status” log is a small scrollable list rather than a resizable text area.